Use Metrics Endpoint to Monitor a model-server
Provided Metrics
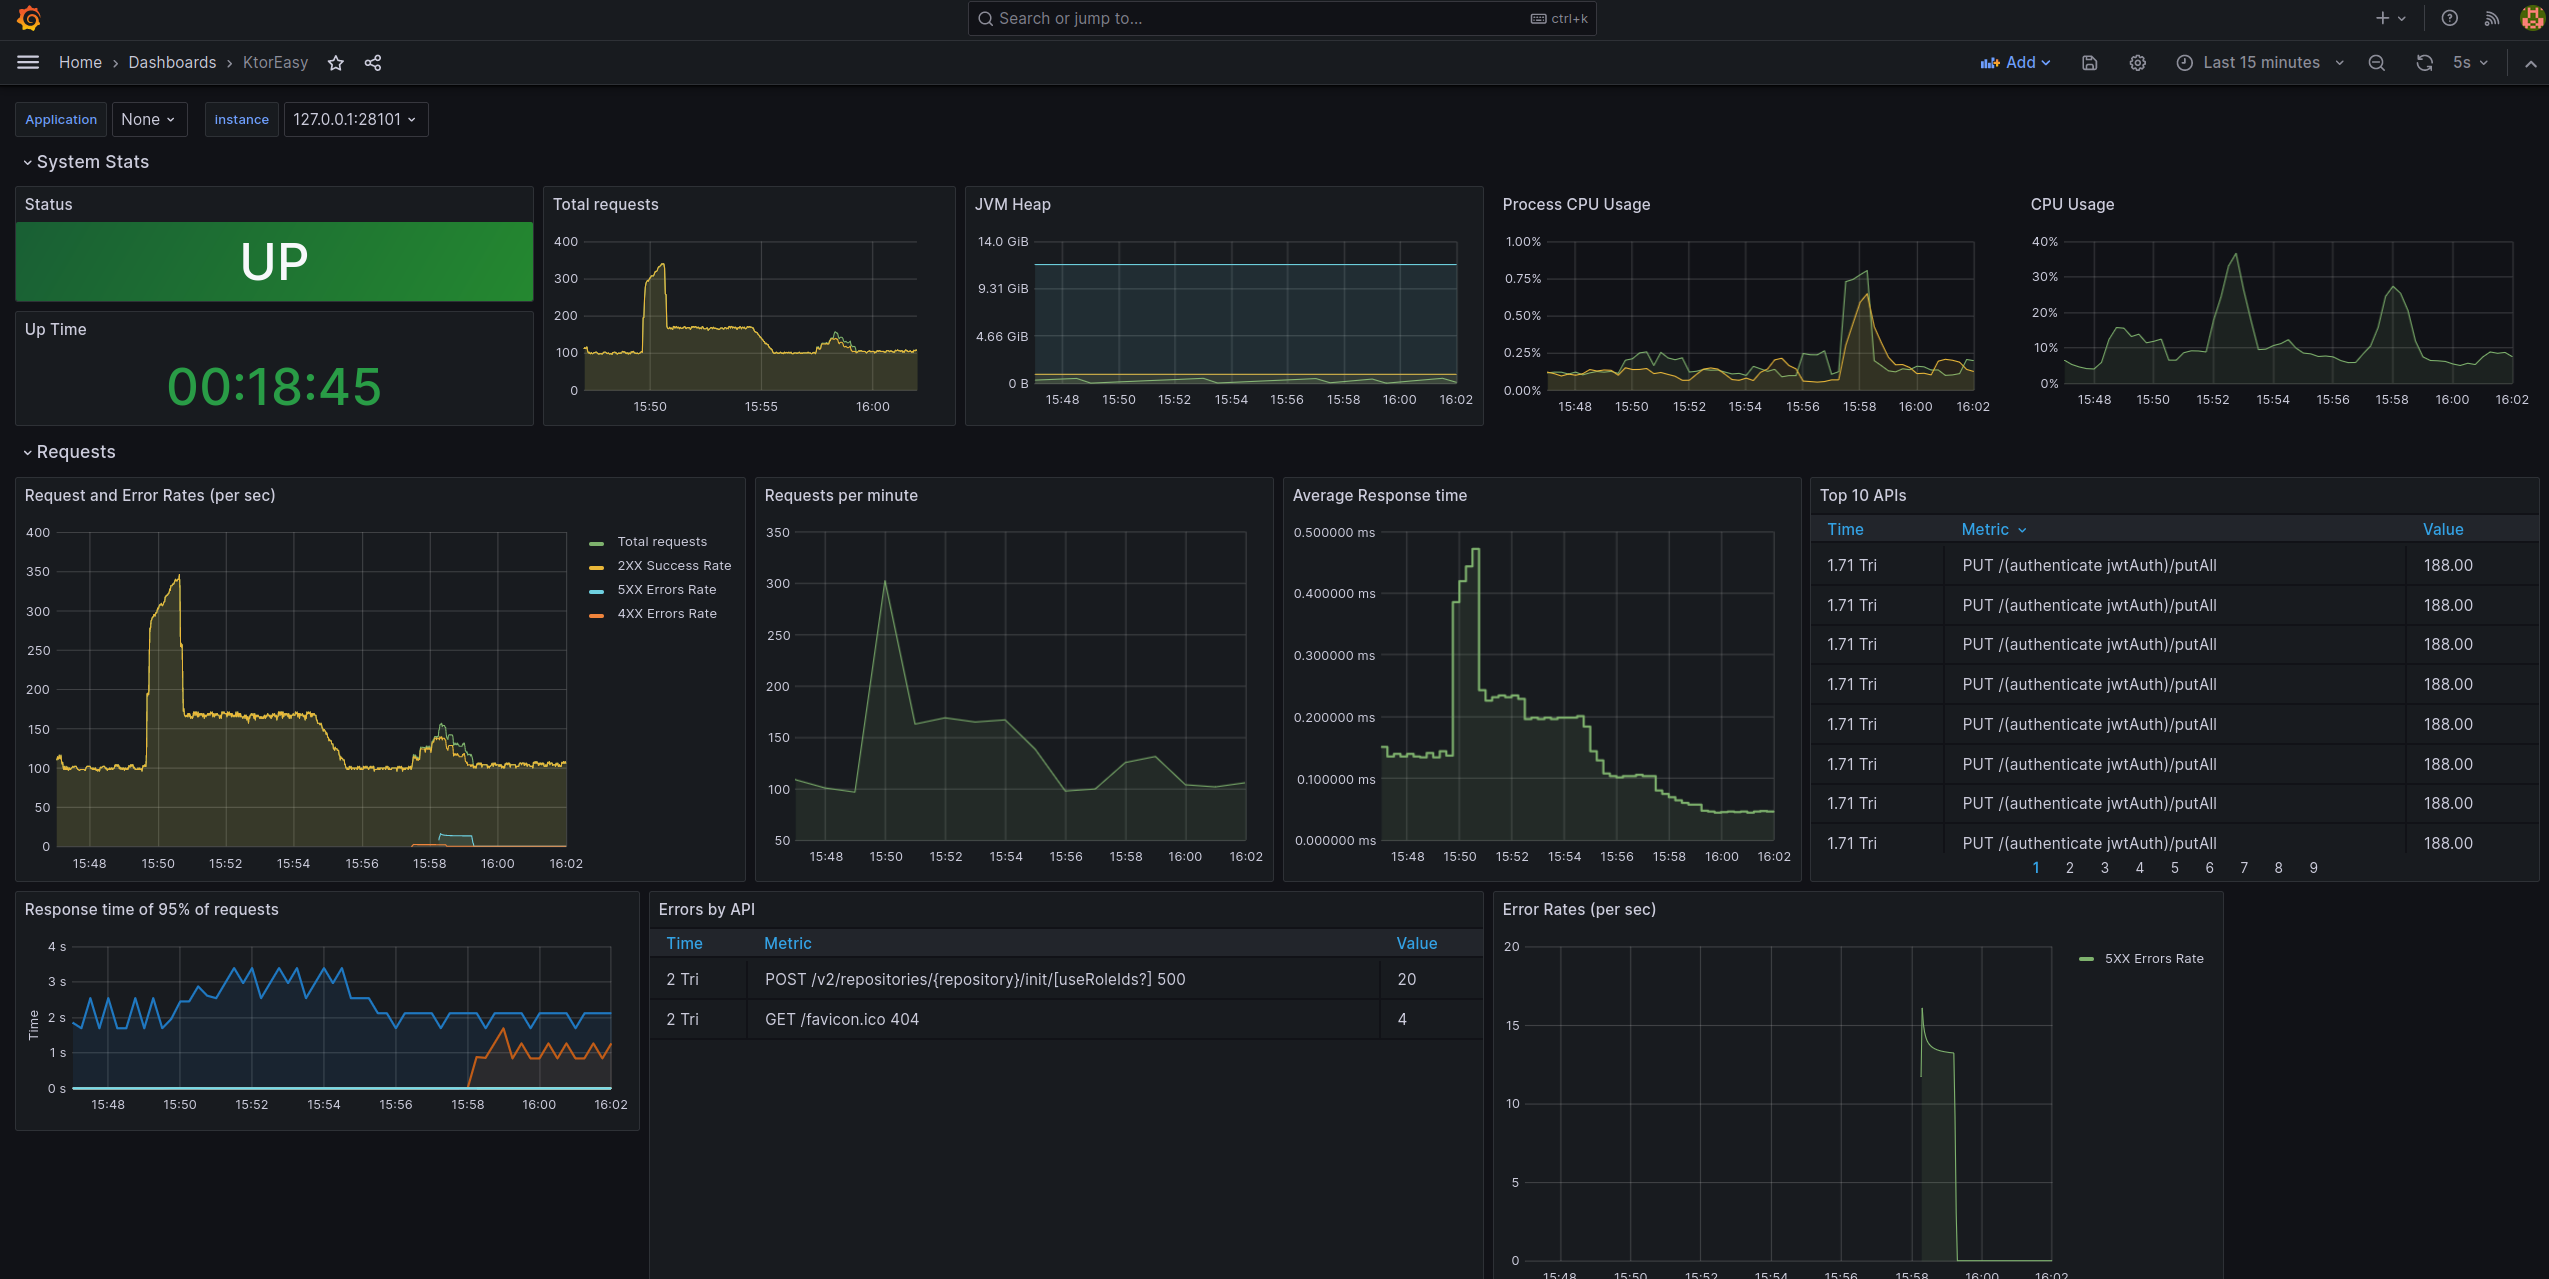
The model-server provides basic metrics at the HTTP endpoint /metrics.
The data can be queried by a monitoring toolkit such as Prometheus and visualized by Grafana.
This How-To will show an exemplary application by deploying these tools using docker.
To run this on your system, you will need
-
docker, and -
docker-compose
Files and Folders
As a quick-start, create the following folder and file structure.
docker-compose will expect this structure when starting the individual components.
monitoring/
├── docker-compose.yaml
├── grafana
│   ├── dashboards
│   │   ├── dashboard.yml
│   │   └── model-server-dashboard.json
│   └── datasources
│       └── datasource.yml
└── prometheus
    └── prometheus.yml
Fill the corresponding files, for example use the following:
Unfold exemplary content docker-compose.yaml
volumes:
  prom_data:

services:
  model-server:
    image: modelix/model-server:latest
    container_name: model-server-monitoring
    ports:
      - 28101:28101
    command: [ "-inmemory" ]

#   Alternatively, if you want data in your model-server, provide a path to a dump here
#    volumes:
#      - /path/to/dump/file.dump:/file.dump
#    command: [ "-inmemory", "-dumpin", "/file.dump" ]


  prometheus:
    image: prom/prometheus
    container_name: prometheus
    command:
      - '--config.file=/etc/prometheus/prometheus.yml'
    ports:
      - 9090:9090
    restart: unless-stopped
    volumes:
      - ./prometheus:/etc/prometheus
      - prom_data:/prometheus

  grafana:
    image: grafana/grafana-oss
    container_name: grafana
    ports:
      - 3001:3000
    restart: unless-stopped
    environment:
      - GF_SECURITY_ADMIN_USER=admin
      - GF_SECURITY_ADMIN_PASSWORD=grafana
      - GF_AUTH_ANONYMOUS_ENABLED=true
      - GF_DASHBOARDS_DEFAULT_HOME_DASHBOARD_PATH=/etc/grafana/provisioning/dashboards/model-server-dashboard.json
    volumes:
      - ./grafana/datasources:/etc/grafana/provisioning/datasources/
      - ./grafana/dashboards:/etc/grafana/provisioning/dashboards/
Unfold exemplary content prometheus.yaml
global:
  scrape_interval: 1s
  scrape_timeout: 1s
  evaluation_interval: 1s
alerting:
  alertmanagers:
    - static_configs:
        - targets: []
      scheme: http
      timeout: 10s
      api_version: v1
scrape_configs:
  - job_name: prometheus
    honor_timestamps: true
    scrape_interval: 1s
    scrape_timeout: 1s
    metrics_path: /metrics
    scheme: http
    static_configs:
      - targets: # depend on your local deployment and OS
          - model-server-monitoring:28101
          - localhost:28101
          - 127.0.0.1:28101 # For connecting to a scrape endpoint from Prometheus running in a Docker container
          - host.docker.internal:28101 # For connecting to a scrape endpoint from Prometheus running in a Docker container
Unfold exemplary content datasource.yaml
apiVersion: 1

datasources:
  - name: Prometheus
    type: prometheus
    url: http://prometheus:9090
    isDefault: true
    access: proxy
    editable: true
Unfold exemplary content dashboard.yml
apiVersion: 1

providers:
  - name: 'default'
    orgId: 1
    folder: ''
    type: file
    disableDeletion: false
    editable: true
    updateIntervalSeconds: 10 #how often Grafana will scan for changed dashboards
    options:
      path: /etc/grafana/provisioning/dashboards
Unfold exemplary content model-server-dashboard.json
{
"annotations": {
"list": [
{
"builtIn": 1,
"datasource": {
"type": "datasource",
"uid": "grafana"
},
"enable": true,
"hide": true,
"iconColor": "rgba(0, 211, 255, 1)",
"name": "Annotations & Alerts",
"type": "dashboard"
}
]
},
"description": "",
"editable": true,
"fiscalYearStartMonth": 0,
"gnetId": 5373,
"graphTooltip": 0,
"id": 1,
"links": [],
"liveNow": false,
"panels": [
{
"datasource": {
"type": "prometheus",
"uid": "a39a3aac-ba97-4593-8df1-da901888433e"
},
"gridPos": {
"h": 1,
"w": 24,
"x": 0,
"y": 0
},
"id": 41,
"targets": [
{
"datasource": {
"type": "prometheus",
"uid": "a39a3aac-ba97-4593-8df1-da901888433e"
},
"refId": "A"
}
],
"title": "System Stats",
"type": "row"
},
{
"datasource": {
"type": "prometheus",
"uid": "PBFA97CFB590B2093"
},
"fieldConfig": {
"defaults": {
"color": {
"mode": "thresholds"
},
"mappings": [
{
"options": {
"0": {
"text": "DOWN"
},
"1": {
"text": "UP"
}
},
"type": "value"
},
{
"options": {
"match": "null",
"result": {
"text": "DOWN"
}
},
"type": "special"
}
],
"thresholds": {
"mode": "absolute",
"steps": [
{
"color": "#F2495C",
"value": null
},
{
"color": "#F2495C",
"value": 0
},
{
"color": "#299c46",
"value": 1
}
]
},
"unit": "none"
},
"overrides": []
},
"gridPos": {
"h": 4,
"w": 3,
"x": 0,
"y": 1
},
"id": 4,
"links": [],
"maxDataPoints": 100,
"options": {
"colorMode": "background",
"graphMode": "none",
"justifyMode": "auto",
"orientation": "horizontal",
"reduceOptions": {
"calcs": [
"lastNotNull"
],
"fields": "",
"values": false
},
"textMode": "auto",
"wideLayout": true
},
"pluginVersion": "10.2.3",
"targets": [
{
"datasource": {
"type": "prometheus",
"uid": "a39a3aac-ba97-4593-8df1-da901888433e"
},
"editorMode": "code",
"expr": "up{instance=\"$instance\"}",
"format": "time_series",
"intervalFactor": 1,
"range": true,
"refId": "A"
}
],
"title": "Status",
"type": "stat"
},
{
"datasource": {
"type": "prometheus",
"uid": "PBFA97CFB590B2093"
},
"fieldConfig": {
"defaults": {
"color": {
"mode": "palette-classic"
},
"custom": {
"axisBorderShow": false,
"axisCenteredZero": false,
"axisColorMode": "text",
"axisLabel": "",
"axisPlacement": "auto",
"barAlignment": 0,
"drawStyle": "line",
"fillOpacity": 10,
"gradientMode": "none",
"hideFrom": {
"legend": false,
"tooltip": false,
"viz": false
},
"insertNulls": false,
"lineInterpolation": "linear",
"lineWidth": 1,
"pointSize": 5,
"scaleDistribution": {
"type": "linear"
},
"showPoints": "never",
"spanNulls": false,
"stacking": {
"group": "A",
"mode": "none"
},
"thresholdsStyle": {
"mode": "off"
}
},
"mappings": [],
"thresholds": {
"mode": "absolute",
"steps": [
{
"color": "green",
"value": null
},
{
"color": "red",
"value": 80
}
]
},
"unit": "short"
},
"overrides": []
},
"gridPos": {
"h": 8,
"w": 5,
"x": 3,
"y": 1
},
"id": 50,
"interval": "1s",
"links": [],
"options": {
"legend": {
"calcs": [],
"displayMode": "list",
"placement": "right",
"showLegend": false
},
"tooltip": {
"mode": "multi",
"sort": "none"
}
},
"pluginVersion": "10.2.3",
"targets": [
{
"datasource": {
"type": "prometheus",
"uid": "a39a3aac-ba97-4593-8df1-da901888433e"
},
"editorMode": "code",
"expr": "sum (increase(ktor_http_server_requests_seconds_count{route!=\"/metrics\"}[1m]))",
"format": "time_series",
"interval": "",
"intervalFactor": 1,
"legendFormat": "Total requests",
"range": true,
"refId": "A",
"step": 4
},
{
"datasource": {
"type": "prometheus",
"uid": "a39a3aac-ba97-4593-8df1-da901888433e"
},
"expr": "sum (increase(ktor_http_server_requests_seconds_count{status=~\"^2..$\", route!=\"/metrics\"}[1m]))",
"format": "time_series",
"intervalFactor": 1,
"legendFormat": "2XX Success Rate",
"refId": "D",
"step": 2
}
],
"title": "Total requests",
"type": "timeseries"
},
{
"datasource": {
"type": "prometheus",
"uid": "PBFA97CFB590B2093"
},
"fieldConfig": {
"defaults": {
"color": {
"mode": "palette-classic"
},
"custom": {
"axisBorderShow": false,
"axisCenteredZero": false,
"axisColorMode": "text",
"axisLabel": "",
"axisPlacement": "auto",
"barAlignment": 0,
"drawStyle": "line",
"fillOpacity": 10,
"gradientMode": "none",
"hideFrom": {
"legend": false,
"tooltip": false,
"viz": false
},
"insertNulls": false,
"lineInterpolation": "linear",
"lineWidth": 1,
"pointSize": 5,
"scaleDistribution": {
"type": "linear"
},
"showPoints": "never",
"spanNulls": false,
"stacking": {
"group": "A",
"mode": "none"
},
"thresholdsStyle": {
"mode": "off"
}
},
"decimals": 2,
"mappings": [],
"thresholds": {
"mode": "absolute",
"steps": [
{
"color": "green",
"value": null
},
{
"color": "red",
"value": 80
}
]
},
"unit": "percent"
},
"overrides": []
},
"gridPos": {
"h": 8,
"w": 6,
"x": 8,
"y": 1
},
"id": 32,
"links": [],
"options": {
"legend": {
"calcs": [
"mean",
"lastNotNull",
"max",
"min",
"sum"
],
"displayMode": "list",
"placement": "right",
"showLegend": false
},
"tooltip": {
"mode": "multi",
"sort": "none"
}
},
"pluginVersion": "10.2.3",
"targets": [
{
"datasource": {
"type": "prometheus",
"uid": "a39a3aac-ba97-4593-8df1-da901888433e"
},
"editorMode": "code",
"expr": "rate(process_cpu_usage{}[1m])*100",
"format": "time_series",
"hide": false,
"instant": false,
"intervalFactor": 1,
"legendFormat": "All",
"refId": "A"
},
{
"datasource": {
"type": "prometheus",
"uid": "PBFA97CFB590B2093"
},
"disableTextWrap": false,
"editorMode": "code",
"expr": "rate(system_cpu_usage{instance=\"$instance\"}[1m])*100",
"fullMetaSearch": false,
"hide": false,
"includeNullMetadata": true,
"instant": false,
"legendFormat": "Instance",
"range": true,
"refId": "B",
"useBackend": false
}
],
"title": "Process CPU Usage",
"transparent": true,
"type": "timeseries"
},
{
"datasource": {
"type": "prometheus",
"uid": "PBFA97CFB590B2093"
},
"fieldConfig": {
"defaults": {
"color": {
"mode": "palette-classic"
},
"custom": {
"axisBorderShow": false,
"axisCenteredZero": false,
"axisColorMode": "text",
"axisLabel": "",
"axisPlacement": "auto",
"barAlignment": 0,
"drawStyle": "line",
"fillOpacity": 10,
"gradientMode": "none",
"hideFrom": {
"legend": false,
"tooltip": false,
"viz": false
},
"insertNulls": false,
"lineInterpolation": "linear",
"lineWidth": 1,
"pointSize": 5,
"scaleDistribution": {
"type": "linear"
},
"showPoints": "never",
"spanNulls": false,
"stacking": {
"group": "A",
"mode": "none"
},
"thresholdsStyle": {
"mode": "off"
}
},
"mappings": [],
"min": 0,
"thresholds": {
"mode": "absolute",
"steps": [
{
"color": "green",
"value": null
},
{
"color": "red",
"value": 80
}
]
},
"unit": "bytes"
},
"overrides": []
},
"gridPos": {
"h": 8,
"w": 5,
"x": 14,
"y": 1
},
"id": 47,
"links": [],
"options": {
"legend": {
"calcs": [
"lastNotNull",
"max"
],
"displayMode": "list",
"placement": "bottom",
"showLegend": false
},
"tooltip": {
"mode": "multi",
"sort": "none"
}
},
"pluginVersion": "10.2.3",
"targets": [
{
"datasource": {
"type": "prometheus",
"uid": "a39a3aac-ba97-4593-8df1-da901888433e"
},
"editorMode": "code",
"expr": "sum(jvm_memory_used_bytes{instance=\"$instance\", area=\"heap\"})",
"format": "time_series",
"intervalFactor": 2,
"legendFormat": "used",
"metric": "",
"range": true,
"refId": "A",
"step": 2400
},
{
"datasource": {
"type": "prometheus",
"uid": "a39a3aac-ba97-4593-8df1-da901888433e"
},
"editorMode": "code",
"expr": "sum(jvm_memory_committed_bytes{instance=\"$instance\", area=\"heap\"})",
"format": "time_series",
"intervalFactor": 2,
"legendFormat": "committed",
"range": true,
"refId": "B",
"step": 2400
},
{
"datasource": {
"type": "prometheus",
"uid": "a39a3aac-ba97-4593-8df1-da901888433e"
},
"editorMode": "code",
"expr": "sum(jvm_memory_max_bytes{instance=\"$instance\", area=\"heap\"})",
"format": "time_series",
"intervalFactor": 2,
"legendFormat": "max",
"range": true,
"refId": "C",
"step": 2400
}
],
"title": "JVM Heap",
"type": "timeseries"
},
{
"datasource": {
"type": "prometheus",
"uid": "PBFA97CFB590B2093"
},
"fieldConfig": {
"defaults": {
"color": {
"mode": "palette-classic"
},
"custom": {
"axisBorderShow": false,
"axisCenteredZero": false,
"axisColorMode": "text",
"axisLabel": "",
"axisPlacement": "auto",
"barAlignment": 0,
"drawStyle": "line",
"fillOpacity": 0,
"gradientMode": "none",
"hideFrom": {
"legend": false,
"tooltip": false,
"viz": false
},
"insertNulls": false,
"lineInterpolation": "linear",
"lineWidth": 1,
"pointSize": 5,
"scaleDistribution": {
"type": "linear"
},
"showPoints": "auto",
"spanNulls": false,
"stacking": {
"group": "A",
"mode": "none"
},
"thresholdsStyle": {
"mode": "off"
}
},
"mappings": [],
"thresholds": {
"mode": "absolute",
"steps": [
{
"color": "green",
"value": null
},
{
"color": "red",
"value": 80
}
]
}
},
"overrides": []
},
"gridPos": {
"h": 8,
"w": 5,
"x": 19,
"y": 1
},
"id": 53,
"options": {
"legend": {
"calcs": [],
"displayMode": "list",
"placement": "bottom",
"showLegend": false
},
"tooltip": {
"mode": "single",
"sort": "none"
}
},
"targets": [
{
"datasource": {
"type": "prometheus",
"uid": "PBFA97CFB590B2093"
},
"editorMode": "code",
"expr": "process_files_open_files",
"instant": false,
"legendFormat": "Open Files",
"range": true,
"refId": "A"
}
],
"title": "Open Files",
"type": "timeseries"
},
{
"datasource": {
"type": "prometheus",
"uid": "PBFA97CFB590B2093"
},
"fieldConfig": {
"defaults": {
"color": {
"mode": "thresholds"
},
"decimals": 1,
"mappings": [
{
"options": {
"match": "null",
"result": {
"text": "N/A"
}
},
"type": "special"
}
],
"thresholds": {
"mode": "absolute",
"steps": [
{
"color": "#d44a3a",
"value": null
},
{
"color": "rgba(237, 129, 40, 0.89)",
"value": 60
},
{
"color": "#299c46",
"value": 120
}
]
},
"unit": "dthms"
},
"overrides": []
},
"gridPos": {
"h": 4,
"w": 3,
"x": 0,
"y": 5
},
"id": 18,
"interval": "",
"links": [],
"maxDataPoints": 100,
"options": {
"colorMode": "value",
"graphMode": "none",
"justifyMode": "auto",
"orientation": "horizontal",
"reduceOptions": {
"calcs": [
"lastNotNull"
],
"fields": "",
"values": false
},
"textMode": "auto",
"wideLayout": true
},
"pluginVersion": "10.2.3",
"targets": [
{
"datasource": {
"type": "prometheus",
"uid": "a39a3aac-ba97-4593-8df1-da901888433e"
},
"editorMode": "code",
"expr": "process_uptime_seconds{instance=\"$instance\"}",
"format": "time_series",
"intervalFactor": 1,
"range": true,
"refId": "A"
}
],
"title": "Up Time",
"type": "stat"
},
{
"collapsed": false,
"datasource": {
"type": "prometheus",
"uid": "a39a3aac-ba97-4593-8df1-da901888433e"
},
"gridPos": {
"h": 1,
"w": 24,
"x": 0,
"y": 9
},
"id": 37,
"panels": [],
"targets": [
{
"datasource": {
"type": "prometheus",
"uid": "a39a3aac-ba97-4593-8df1-da901888433e"
},
"refId": "A"
}
],
"title": "Requests",
"type": "row"
},
{
"datasource": {
"type": "prometheus",
"uid": "PBFA97CFB590B2093"
},
"fieldConfig": {
"defaults": {
"color": {
"mode": "palette-classic"
},
"custom": {
"axisBorderShow": false,
"axisCenteredZero": false,
"axisColorMode": "text",
"axisLabel": "",
"axisPlacement": "auto",
"barAlignment": 0,
"drawStyle": "line",
"fillOpacity": 10,
"gradientMode": "none",
"hideFrom": {
"legend": false,
"tooltip": false,
"viz": false
},
"insertNulls": false,
"lineInterpolation": "linear",
"lineWidth": 1,
"pointSize": 5,
"scaleDistribution": {
"type": "linear"
},
"showPoints": "never",
"spanNulls": false,
"stacking": {
"group": "A",
"mode": "none"
},
"thresholdsStyle": {
"mode": "off"
}
},
"mappings": [],
"thresholds": {
"mode": "absolute",
"steps": [
{
"color": "green",
"value": null
},
{
"color": "red",
"value": 80
}
]
},
"unit": "short"
},
"overrides": []
},
"gridPos": {
"h": 11,
"w": 7,
"x": 0,
"y": 10
},
"id": 34,
"interval": "1s",
"links": [],
"options": {
"legend": {
"calcs": [],
"displayMode": "list",
"placement": "right",
"showLegend": true
},
"tooltip": {
"mode": "multi",
"sort": "none"
}
},
"pluginVersion": "10.2.3",
"targets": [
{
"datasource": {
"type": "prometheus",
"uid": "a39a3aac-ba97-4593-8df1-da901888433e"
},
"editorMode": "code",
"expr": "sum (increase(ktor_http_server_requests_seconds_count{route!=\"/metrics\"}[1m]))",
"format": "time_series",
"interval": "",
"intervalFactor": 1,
"legendFormat": "Total requests",
"range": true,
"refId": "A",
"step": 4
},
{
"datasource": {
"type": "prometheus",
"uid": "a39a3aac-ba97-4593-8df1-da901888433e"
},
"editorMode": "code",
"expr": "sum (increase(ktor_http_server_requests_seconds_count{status=~\"^2..$\", route!=\"/metrics\"}[1m]))",
"format": "time_series",
"intervalFactor": 1,
"legendFormat": "2XX Success Rate",
"range": true,
"refId": "D",
"step": 2
},
{
"datasource": {
"type": "prometheus",
"uid": "a39a3aac-ba97-4593-8df1-da901888433e"
},
"expr": "sum (increase(ktor_http_server_requests_seconds_count{status=~\"^5..$\", route!=\"/metrics\"}[1m]))",
"format": "time_series",
"interval": "",
"intervalFactor": 1,
"legendFormat": "5XX Errors Rate",
"refId": "B",
"step": 4
},
{
"datasource": {
"type": "prometheus",
"uid": "a39a3aac-ba97-4593-8df1-da901888433e"
},
"expr": "sum (increase(ktor_http_server_requests_seconds_count{status=~\"^4..$\", status!=\"^401$\", route!=\"/metrics\"}[1m]))",
"format": "time_series",
"intervalFactor": 1,
"legendFormat": "4XX Errors Rate",
"refId": "C",
"step": 2
},
{
"datasource": {
"type": "prometheus",
"uid": "a39a3aac-ba97-4593-8df1-da901888433e"
},
"expr": "sum (increase(ktor_http_server_requests_seconds_count{status=~\"^401$\", route!=\"/metrics\"}[1m]))",
"format": "time_series",
"intervalFactor": 1,
"legendFormat": "Unauthorised Errors Rate",
"refId": "E",
"step": 2
}
],
"title": "Request and Error Rates (per sec)",
"type": "timeseries"
},
{
"datasource": {},
"fieldConfig": {
"defaults": {
"color": {
"mode": "palette-classic"
},
"custom": {
"axisBorderShow": false,
"axisCenteredZero": false,
"axisColorMode": "text",
"axisLabel": "",
"axisPlacement": "auto",
"barAlignment": 0,
"drawStyle": "line",
"fillOpacity": 10,
"gradientMode": "none",
"hideFrom": {
"legend": false,
"tooltip": false,
"viz": false
},
"insertNulls": false,
"lineInterpolation": "stepAfter",
"lineWidth": 2,
"pointSize": 5,
"scaleDistribution": {
"type": "linear"
},
"showPoints": "never",
"spanNulls": false,
"stacking": {
"group": "A",
"mode": "none"
},
"thresholdsStyle": {
"mode": "off"
}
},
"decimals": 6,
"mappings": [],
"min": 0,
"thresholds": {
"mode": "absolute",
"steps": [
{
"color": "green",
"value": null
},
{
"color": "red",
"value": 80
}
]
},
"unit": "ms"
},
"overrides": [
{
"matcher": {
"id": "byValue",
"options": {
"op": "gte",
"reducer": "allIsZero",
"value": 0
}
},
"properties": [
{
"id": "custom.hideFrom",
"value": {
"legend": true,
"tooltip": true,
"viz": false
}
}
]
},
{
"matcher": {
"id": "byValue",
"options": {
"op": "gte",
"reducer": "allIsNull",
"value": 0
}
},
"properties": [
{
"id": "custom.hideFrom",
"value": {
"legend": true,
"tooltip": true,
"viz": false
}
}
]
}
]
},
"gridPos": {
"h": 9,
"w": 5,
"x": 7,
"y": 10
},
"id": 29,
"links": [],
"options": {
"legend": {
"calcs": [
"lastNotNull"
],
"displayMode": "list",
"placement": "bottom",
"showLegend": false
},
"tooltip": {
"mode": "multi",
"sort": "none"
}
},
"pluginVersion": "10.2.3",
"targets": [
{
"datasource": {
"type": "prometheus",
"uid": "a39a3aac-ba97-4593-8df1-da901888433e"
},
"editorMode": "code",
"expr": "avg(rate(ktor_http_server_requests_seconds_count{route!=\"/metrics\"}[1m]))",
"format": "time_series",
"instant": false,
"intervalFactor": 1,
"legendFormat": "Response time",
"refId": "A"
}
],
"title": "Average Response time",
"type": "timeseries"
},
{
"datasource": {},
"fieldConfig": {
"defaults": {
"color": {
"mode": "palette-classic"
},
"custom": {
"axisBorderShow": false,
"axisCenteredZero": false,
"axisColorMode": "text",
"axisLabel": "",
"axisPlacement": "auto",
"barAlignment": 0,
"drawStyle": "line",
"fillOpacity": 10,
"gradientMode": "none",
"hideFrom": {
"legend": false,
"tooltip": false,
"viz": false
},
"insertNulls": false,
"lineInterpolation": "linear",
"lineWidth": 1,
"pointSize": 5,
"scaleDistribution": {
"type": "linear"
},
"showPoints": "never",
"spanNulls": false,
"stacking": {
"group": "A",
"mode": "none"
},
"thresholdsStyle": {
"mode": "off"
}
},
"mappings": [],
"thresholds": {
"mode": "absolute",
"steps": [
{
"color": "green",
"value": null
},
{
"color": "red",
"value": 80
}
]
},
"unit": "short"
},
"overrides": []
},
"gridPos": {
"h": 9,
"w": 5,
"x": 12,
"y": 10
},
"id": 38,
"interval": "1m",
"links": [],
"options": {
"legend": {
"calcs": [],
"displayMode": "list",
"placement": "bottom",
"showLegend": false
},
"tooltip": {
"mode": "multi",
"sort": "none"
}
},
"pluginVersion": "10.2.3",
"targets": [
{
"datasource": {
"type": "prometheus",
"uid": "a39a3aac-ba97-4593-8df1-da901888433e"
},
"editorMode": "code",
"expr": "sum (increase(ktor_http_server_requests_seconds_count{route!=\"/metrics\"}[1m]))",
"format": "time_series",
"intervalFactor": 1,
"legendFormat": "Total requests (min)",
"range": true,
"refId": "D",
"step": 2
}
],
"title": "Requests per minute",
"type": "timeseries"
},
{
"datasource": {
"type": "prometheus",
"uid": "PBFA97CFB590B2093"
},
"fieldConfig": {
"defaults": {
"color": {
"mode": "thresholds"
},
"custom": {
"align": "center",
"cellOptions": {
"type": "auto"
},
"inspect": false
},
"decimals": 2,
"displayName": "",
"mappings": [],
"thresholds": {
"mode": "absolute",
"steps": [
{
"color": "green",
"value": null
},
{
"color": "red",
"value": 80
}
]
},
"unit": "short"
},
"overrides": []
},
"gridPos": {
"h": 10,
"w": 7,
"x": 17,
"y": 10
},
"id": 16,
"interval": "",
"links": [],
"options": {
"cellHeight": "sm",
"footer": {
"countRows": false,
"fields": "",
"reducer": [
"sum"
],
"show": false
},
"showHeader": true,
"sortBy": [
{
"desc": true,
"displayName": "Value"
}
]
},
"pluginVersion": "10.2.3",
"targets": [
{
"datasource": {
"type": "prometheus",
"uid": "a39a3aac-ba97-4593-8df1-da901888433e"
},
"editorMode": "code",
"expr": "topk(9, sort_desc(sum by(route, method) (ktor_http_server_requests_seconds_count{route!=\"/metrics\"})))",
"format": "time_series",
"hide": true,
"intervalFactor": 1,
"legendFormat": "{{method}} {{route}}",
"range": true,
"refId": "A"
},
{
"datasource": {
"type": "prometheus",
"uid": "PBFA97CFB590B2093"
},
"disableTextWrap": false,
"editorMode": "builder",
"exemplar": false,
"expr": "sum by(route, method) (ktor_http_server_requests_seconds_count{route!=\"/metrics\"})",
"fullMetaSearch": false,
"hide": false,
"includeNullMetadata": false,
"instant": true,
"legendFormat": "{{method}} {{route}}",
"range": false,
"refId": "B",
"useBackend": false
}
],
"title": "Top Endpoints",
"transformations": [
{
"id": "seriesToRows",
"options": {
"reducers": []
}
},
{
"id": "organize",
"options": {
"excludeByName": {
"Time": true
},
"includeByName": {},
"indexByName": {},
"renameByName": {}
}
}
],
"type": "table"
},
{
"datasource": {
"type": "prometheus",
"uid": "PBFA97CFB590B2093"
},
"fieldConfig": {
"defaults": {
"color": {
"mode": "palette-classic"
},
"custom": {
"axisBorderShow": false,
"axisCenteredZero": false,
"axisColorMode": "text",
"axisLabel": "Time",
"axisPlacement": "auto",
"barAlignment": 0,
"drawStyle": "line",
"fillOpacity": 10,
"gradientMode": "none",
"hideFrom": {
"legend": false,
"tooltip": false,
"viz": false
},
"insertNulls": false,
"lineInterpolation": "linear",
"lineWidth": 2,
"pointSize": 5,
"scaleDistribution": {
"type": "linear"
},
"showPoints": "never",
"spanNulls": false,
"stacking": {
"group": "A",
"mode": "none"
},
"thresholdsStyle": {
"mode": "off"
}
},
"mappings": [],
"thresholds": {
"mode": "absolute",
"steps": [
{
"color": "green",
"value": null
},
{
"color": "red",
"value": 80
}
]
},
"unit": "s"
},
"overrides": [
{
"matcher": {
"id": "byValue",
"options": {
"op": "gte",
"reducer": "allIsZero",
"value": 0
}
},
"properties": [
{
"id": "custom.hideFrom",
"value": {
"legend": true,
"tooltip": true,
"viz": false
}
}
]
}
]
},
"gridPos": {
"h": 11,
"w": 10,
"x": 7,
"y": 19
},
"id": 14,
"links": [],
"options": {
"legend": {
"calcs": [
"lastNotNull"
],
"displayMode": "list",
"placement": "bottom",
"showLegend": false
},
"tooltip": {
"mode": "multi",
"sort": "none"
}
},
"pluginVersion": "10.2.3",
"targets": [
{
"datasource": {
"type": "prometheus",
"uid": "a39a3aac-ba97-4593-8df1-da901888433e"
},
"editorMode": "code",
"expr": "rate(ktor_http_server_requests_seconds_sum{instance=\"$instance\", route!=\"/metrics\"}[1m])",
"format": "time_series",
"instant": false,
"intervalFactor": 1,
"legendFormat": "{{route}}",
"refId": "A"
}
],
"title": "Response time of requests",
"type": "timeseries"
},
{
"columns": [
{
"$$hashKey": "object:191",
"text": "Total",
"value": "total"
}
],
"datasource": {},
"fontSize": "100%",
"gridPos": {
"h": 10,
"w": 7,
"x": 17,
"y": 20
},
"id": 49,
"interval": "",
"links": [],
"pageSize": 10,
"scroll": true,
"showHeader": true,
"sort": {
"desc": false
},
"styles": [
{
"alias": "",
"align": "auto",
"colors": [
"rgba(245, 54, 54, 0.9)",
"rgba(237, 129, 40, 0.89)",
"rgba(50, 172, 45, 0.97)"
],
"decimals": 0,
"pattern": "/.*/",
"thresholds": [],
"type": "number",
"unit": "short"
}
],
"targets": [
{
"datasource": {
"type": "prometheus",
"uid": "a39a3aac-ba97-4593-8df1-da901888433e"
},
"editorMode": "code",
"expr": "topk(10, sort_desc(sum by(route, method, status) (ktor_http_server_requests_seconds_count{route!=\"/metrics\", status!=\"200\"})))",
"format": "time_series",
"hide": false,
"instant": true,
"interval": "",
"intervalFactor": 1,
"legendFormat": "{{method}} {{route}} {{status}}",
"refId": "A"
}
],
"title": "Errors by API",
"transform": "timeseries_to_rows",
"type": "table-old"
},
{
"datasource": {
"type": "prometheus",
"uid": "PBFA97CFB590B2093"
},
"fieldConfig": {
"defaults": {
"color": {
"mode": "palette-classic"
},
"custom": {
"axisBorderShow": false,
"axisCenteredZero": false,
"axisColorMode": "text",
"axisLabel": "",
"axisPlacement": "auto",
"barAlignment": 0,
"drawStyle": "line",
"fillOpacity": 10,
"gradientMode": "none",
"hideFrom": {
"legend": false,
"tooltip": false,
"viz": false
},
"insertNulls": false,
"lineInterpolation": "linear",
"lineWidth": 1,
"pointSize": 5,
"scaleDistribution": {
"type": "linear"
},
"showPoints": "never",
"spanNulls": false,
"stacking": {
"group": "A",
"mode": "none"
},
"thresholdsStyle": {
"mode": "off"
}
},
"mappings": [],
"thresholds": {
"mode": "absolute",
"steps": [
{
"color": "green",
"value": null
},
{
"color": "red",
"value": 80
}
]
},
"unit": "short"
},
"overrides": []
},
"gridPos": {
"h": 9,
"w": 7,
"x": 0,
"y": 21
},
"id": 48,
"interval": "1s",
"links": [],
"options": {
"legend": {
"calcs": [],
"displayMode": "table",
"placement": "right",
"showLegend": true
},
"tooltip": {
"mode": "multi",
"sort": "none"
}
},
"pluginVersion": "10.2.3",
"targets": [
{
"datasource": {
"type": "prometheus",
"uid": "a39a3aac-ba97-4593-8df1-da901888433e"
},
"editorMode": "code",
"expr": "sum (increase(ktor_http_server_requests_seconds_count{status=~\"^5..$\", route!=\"/metrics\"}[1m]))",
"format": "time_series",
"interval": "",
"intervalFactor": 2,
"legendFormat": "5XX Errors Rate",
"range": true,
"refId": "B",
"step": 4
},
{
"datasource": {
"type": "prometheus",
"uid": "a39a3aac-ba97-4593-8df1-da901888433e"
},
"editorMode": "code",
"expr": "sum (increase(ktor_http_server_requests_seconds_count{status=\"^4..$\", status!=\"^401$\", route!=\"/metrics\"}[1m]))",
"format": "time_series",
"intervalFactor": 2,
"legendFormat": "4XX Errors Rate",
"range": true,
"refId": "C",
"step": 2
},
{
"datasource": {
"type": "prometheus",
"uid": "a39a3aac-ba97-4593-8df1-da901888433e"
},
"editorMode": "code",
"expr": "sum (increase(ktor_http_server_requests_seconds_count{status=~\"^401$\", route!=\"/metrics\"}[1m]))",
"format": "time_series",
"intervalFactor": 2,
"legendFormat": "Unauthorised Errors Rate",
"range": true,
"refId": "E",
"step": 2
}
],
"title": "Error Rates (per sec)",
"type": "timeseries"
}
],
"refresh": "5s",
"schemaVersion": 39,
"tags": [],
"templating": {
"list": [
{
"current": {
"selected": false,
"text": "model-server-monitoring:28101",
"value": "model-server-monitoring:28101"
},
"datasource": {
"type": "prometheus",
"uid": "PBFA97CFB590B2093"
},
"definition": "label_values(up,instance)",
"hide": 0,
"includeAll": false,
"label": "instance",
"multi": false,
"name": "instance",
"options": [],
"query": {
"qryType": 1,
"query": "label_values(up,instance)",
"refId": "PrometheusVariableQueryEditor-VariableQuery"
},
"refresh": 2,
"regex": "",
"skipUrlSync": false,
"sort": 0,
"tagValuesQuery": "",
"tagsQuery": "",
"type": "query",
"useTags": false
}
]
},
"time": {
"from": "now-15m",
"to": "now"
},
"timepicker": {
"refresh_intervals": [
"5s",
"10s",
"30s",
"1m",
"5m",
"15m",
"30m",
"1h",
"2h",
"1d"
],
"time_options": [
"5m",
"15m",
"1h",
"6h",
"12h",
"24h",
"2d",
"7d",
"30d"
]
},
"timezone": "",
"title": "model-server",
"uid": "omBsPz1Wz",
"version": 11,
"weekStart": ""
}Run the Monitoring Stack
Navigate to your monitoring folder and run
$ docker-compose upThe first start will take some time as both Prometheus and Grafana need to initialize. Once they are done, you can navigate to their respective endpoints at:
-
Prometheus: http://localhost:9090
-
Grafana: http://localhost:3001
To quickly simulate traffic, you can use the Swagger endpoint of the model-server over at:
-
model-server: http://127.0.0.1:28101/swagger